

If your social media report leads with impressions, it’s telling you how loud you were—not whether anyone listened.
For marketing directors at mid-sized B2B companies, that’s where social budgets start to wobble: leadership asks what social media produced, and the report answers with reach. Choosing the right B2B social media metrics is how you close that gap, and one of the clearest recent illustrations of the problem doesn’t come from a B2B company at all.
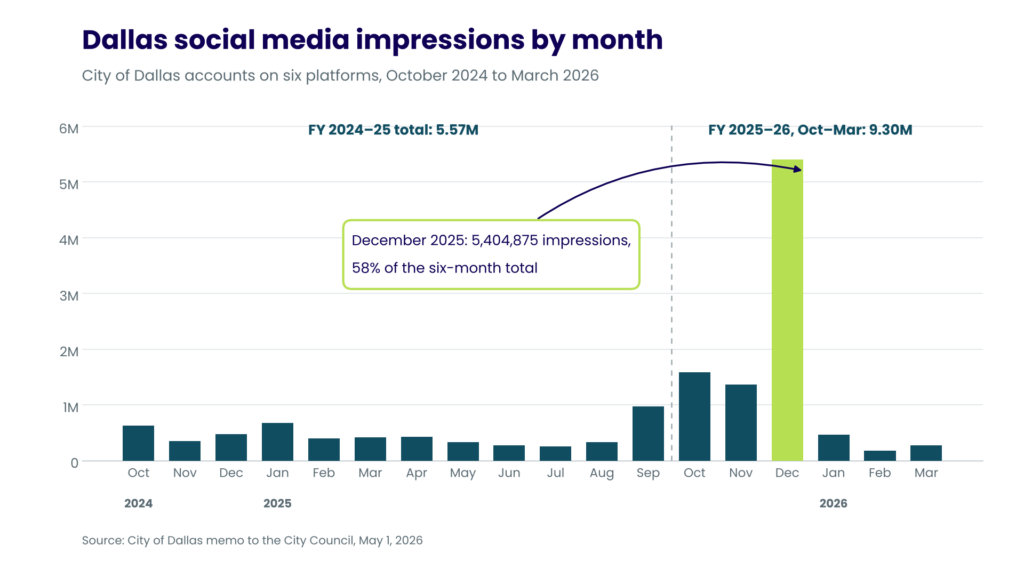
This spring, City Hall in Dallas asked a fair question. A council member wanted to know how the city’s social media was performing, and a May 1, 2026 memo to the City Council answered with impressions: about 9.3 million across six platforms between October 2025 and March 2026, already more than the 5.6 million the city recorded in the whole previous fiscal year.
What the memo couldn’t say was which of those impressions did anything. The city’s communications office, it explained, doesn’t track impressions by individual post or by topic, so there was no way to report how a program like Vision Zero, the city’s traffic-safety initiative, performed on its own. That isn’t a failing unique to Dallas. It’s how most social media reporting works—in government and in B2B alike—and it’s why the question your CEO is really asking, “did it work?”, so often goes unanswered.
What 9.3 Million Impressions Can and Can’t Tell You
Most marketers treat a spike as good news. A month that towers over every other month looks like proof that something worked, and it usually lands on the first slide of the next report.
The Dallas numbers invite a calmer reading. December 2025 alone produced 5,404,875 impressions, about 58% of the six-month total, nearly all of it on Facebook (3.7 million) and Instagram (1.6 million). The memo doesn’t say what drove that month, and with channel-level data it can’t. The city knows its biggest month happened. It doesn’t know why, which means it can’t do it again on purpose.
That’s the quiet reversal: a spike you can’t explain isn’t a result. It’s a question. And once you start reading the numbers that way, the table is full of questions. X impressions fell from 736,771 across the whole previous year to 220,054 in these six months, a shift that may matter a great deal or not at all, and channel totals alone can’t say which. B2B teams hit the same wall every time a post takes off and nobody can tell whether the people who saw it were buyers, competitors, job seekers or someone’s very supportive aunt.
The Four Layers of B2B Social Media Metrics
Think of social media as a trade-show booth. Impressions count everyone who walked past. Engagement counts the people who stopped to watch the demo. Site visits are the ones who took a brochure, and pipeline is whoever booked a meeting before the show closed. Nobody judges a trade show by foot traffic alone, yet that’s exactly what a report built on impressions asks leadership to do.
Most B2B marketers sense this already, even when their reports don’t show it. CMI’s 2026 B2B content and marketing trends research found that a third of marketers (33%) count measuring content effectiveness among their top three challenges, and the measures they lean on explain why. When they evaluate thought leadership, 80% look at audience engagement such as views, downloads and shares, but only 63% look at business impact such as leads and pipeline influence. The foot traffic gets counted more often than the meetings.
The way out is to measure every layer of the booth, knowing what each one can and can’t show. Each layer answers a different question, and each has a blind spot:
| Layer | Example metrics | What it tells you | What it can’t tell you |
| Reach | Impressions, reach, follower growth | Whether your content was seen | Who saw it, or whether they could ever buy |
| Engagement quality | Comments, shares and saves from buyers and target accounts; profile visits from your customer profile | Whether the right people found it worth a reaction | Whether interest turns into action |
| Site actions | Tagged visits, content downloads, contact or demo page views | Whether social sends people toward a next step | Whether those people are qualified |
| Pipeline | Opportunities with social as a first or assisted touch; “How did you hear about us?” answers | Whether social contributes to deals | Exactly how much credit each post deserves |
The point isn’t to throw out reach. It’s to stop letting the top row stand in for the bottom one.
Engagement Is About Who, Not How Many
Engagement is where B2B reporting most often borrows the wrong yardstick. A consumer brand can treat a thousand likes as a thousand small votes. A B2B company selling into a handful of industries might have a few hundred genuine prospects in its entire market, and the people who matter most rarely announce themselves. A plant manager who reads every post you publish may never press a button, and a CFO weighing your proposal is unlikely to comment on it in public.

That’s why the second row of the table is about quality. One thoughtful comment from a director at a target account can be worth more than a post that delighted thousands of strangers, and a modest post a prospect forwards to three colleagues can do more for a deal than anything the like counter shows. Counting reactions tells you how a post performed with your audience in general. Checking who reacted, and whether they work at companies you’d like to sell to, tells you whether it performed with your market.
The platforms make that check easier than it sounds. LinkedIn’s page analytics, for example, break down visitors by attributes such as job function, industry and company size, so you can see at a glance whether attention is coming from the people you actually sell to. What no platform dashboard can show you is which of your topics drew them in. That answer depends on a decision you make before you post.
Tag Before You Post
The city’s question about Vision Zero was the right one. It simply arrived too late, because topic-level answers are built before anything is published, not reconstructed after. Four habits build them:
- Consistent UTM parameters. Every link in a social post carries source, medium and campaign tags, written exactly the same way every time. The consistency matters more than it seems: as Google’s guide to campaign URLs points out, the values are case sensitive, so “LinkedIn” and “linkedin” count as two different sources and quietly split your data.
- A topic tag for every post. Choose a short list of themes your business actually sells around, such as a service line, an industry or a buyer problem, and give every post exactly one. Carry the theme in the campaign or content parameter so it travels with the click.
- Tags that survive into your CRM. Make sure the parameters on a visit carry through to the form fill, so a new lead record shows which topic brought it in.
- A “How did you hear about us?” field. Some of the most valuable social influence never produces a click. A buyer reads your posts for months, then types your URL or asks a colleague for an introduction. A free-text field on your contact form catches what tracking can’t.
In practice, a LinkedIn post from an industrial equipment supplier promoting a safety-compliance guide might link to yoursite.com/safety-guide?utm_source=linkedin&utm_medium=social&utm_campaign=safety-compliance&utm_content=checklist-post. Six months later, that one line is the difference between “LinkedIn sent 400 visits” and “our safety-compliance posts sent 400 visits, 30 of them from target accounts, and two turned into opportunities.”
None of this is complicated. It’s just far easier to set up in month one than to reconstruct in month twelve, when leadership asks the question City Hall asked.

What Your Monthly Social Media Report Should Answer
A report that leads with impressions is a bit like a sales rep reporting how many people noticed his car in the client’s parking lot. It’s technically activity. It’s just not the kind anyone gets paid for.
Once the tags are in place, the report can answer the questions leadership actually asks. Five do most of the work:
- Which topics brought target accounts to the site? Not total traffic, but visits from companies that fit your customer profile, broken down by the topic tags you set up.
- What moved into pipeline? Opportunities where social media was a first or assisted touch, plus anything prospects wrote in the “How did you hear about us?” field.
- What did the right people engage with? Comments, shares and saves from buyers, partners and people at target accounts say more than raw reaction counts ever will.
- What changed since last month, and why? A spike or a dip with an explanation attached, so a good month can be repeated on purpose instead of admired.
- What will you stop posting? The topics that drew reach but never moved anyone further down the funnel, and what replaces them.
A report built this way records decisions rather than activity, and that difference says a lot about whoever writes it. An agency that only executes will hand you activity; a strategic partner will hand you decisions, which is the difference between a strategic partner and an execution vendor in a single page. It’s also why asking for a sample report before you sign is one of the six tests in our guide to evaluating a marketing agency.
The Trade Your CEO Might Offer
Imagine your CEO proposes a trade at the next quarterly review. Option one: your impressions double next quarter. Option two: you lose every impression social media has ever earned you, but you keep every lead, opportunity and closed deal it helped produce. Which do you take?
The second option is obviously worth more. The trouble is that most reports can’t say how much more, because that number was never tracked. It’s the same gap that separates the 9.3 million impressions Dallas could report from the Vision Zero answer it couldn’t give, and it runs through most B2B reporting, too.
Closing it doesn’t take a new platform. It takes tags set before posting, a report built around the questions above, and the discipline to let the bottom row of the table count for more than the top one. Whether you run social media in-house or with a Dallas social media team, that’s the standard worth holding it to.
If you’d like reporting that can answer the CEO’s trade, let’s look at yours together.

